Sieve Analysis & Particle Size Analysis


Sieve Analysis
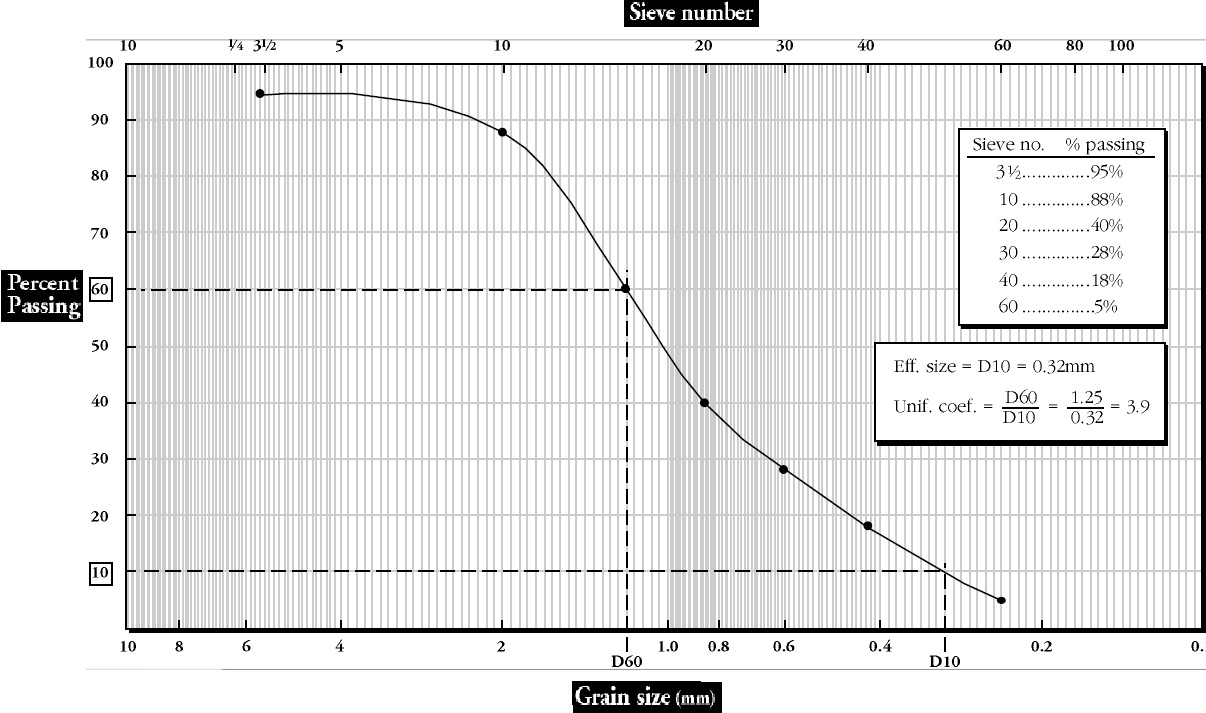
Sieve analysis is used to determine the grain size distribution of coarse-grained soils. For the particle size distribution of fine-grained soils, a hydrometer analysis is used. Particle size distribution is represented on a semi-logarithmic plot of % finer (ordinate, arithmetic scale) versus particle size (abscissa, logarithm scale). The particle size distribution plot is used to delineate the different soil textures (percentages of gravel, sand, silt, and clay) in soil. The effective size, D10, is the diameter of the particles of which 10% of the soil is finer. D10 is an important value in regulating flow through soils and can significantly influence the mechanical behavior of soils.
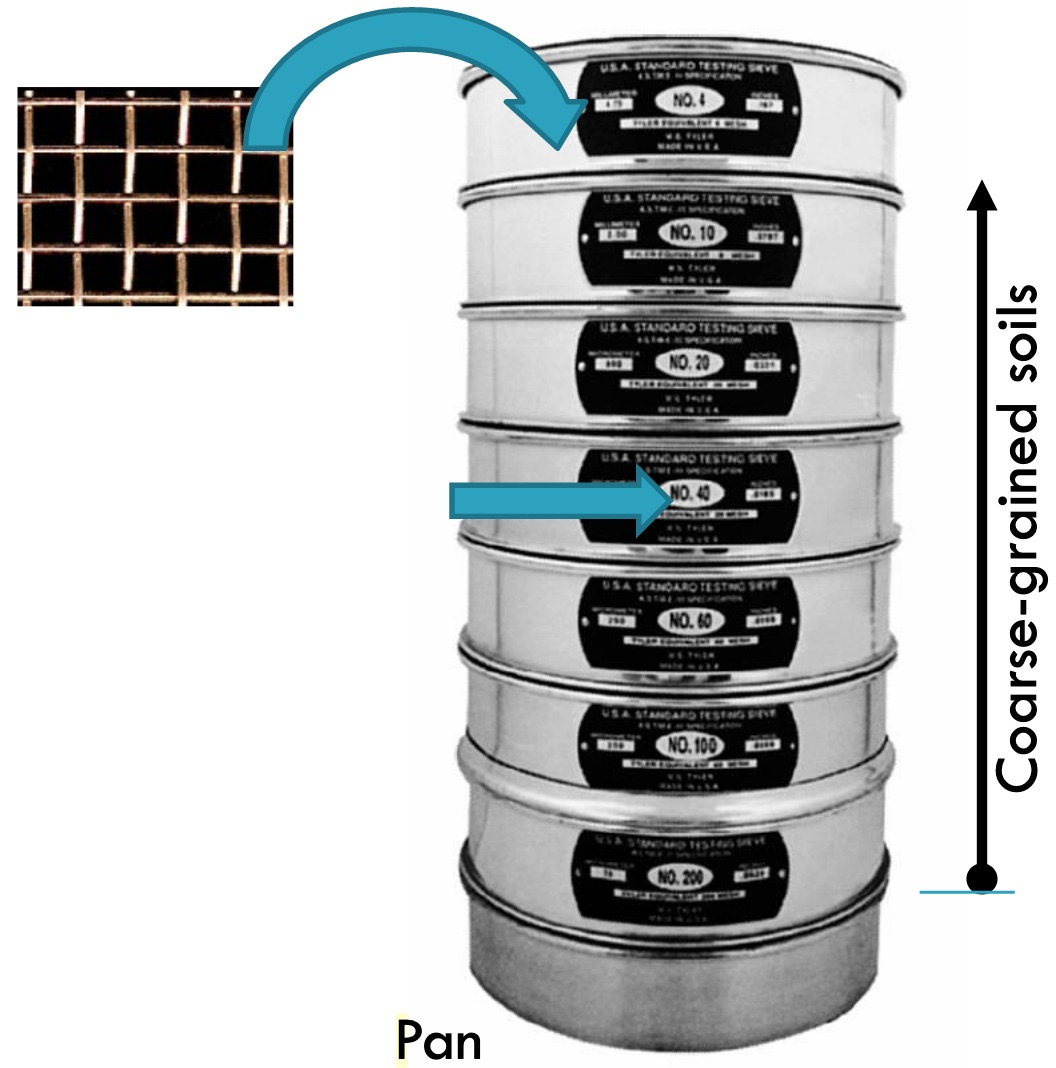
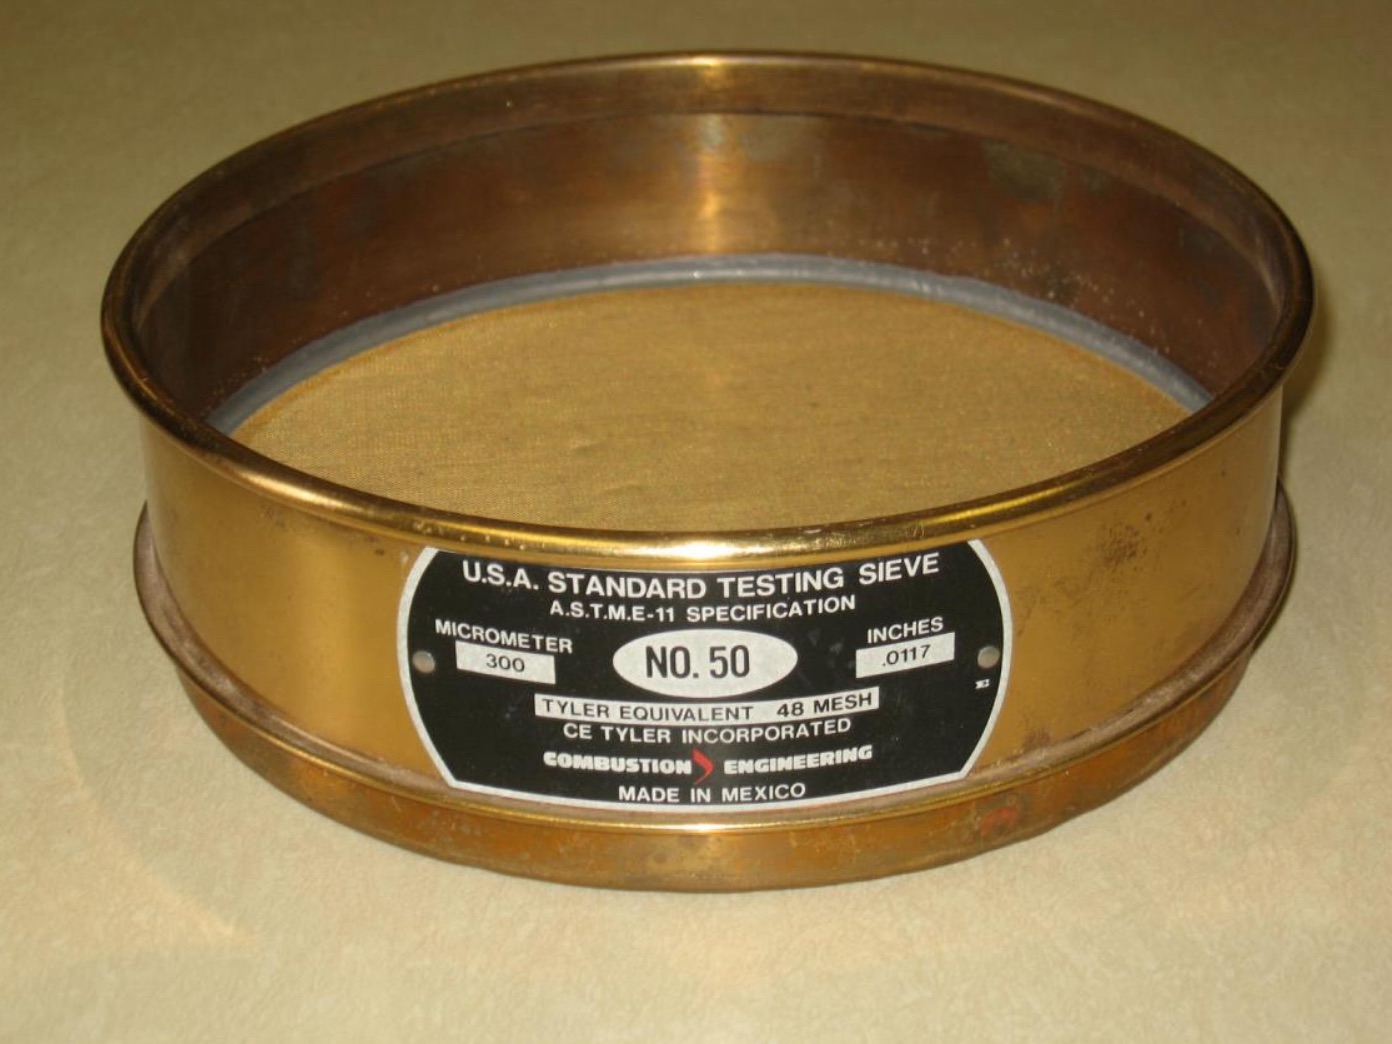
The grain size characteristics of soils that are predominantly coarse-grained are evaluated by a sieve analysis. A nest of sieves is prepared by stacking test sieves one above the other with the largest opening at the top followed by sieves of successively smaller openings and a catch pan at the bottom. Opening mesh sizes of commonly used sieves are shown in the table below.
Two coefficients–the uniformity coefficient and the coefficient of curvature–are used to characterize the particle size distribution. Poorly graded soils have uniformity coefficients < 4 and steep gradation curves. Well-graded soils have uniformity coefficients > 4, coefficients of curvature between 1 and 3, and flat gradation curves. Gap-graded soils have coefficients of curvature < 1 or > 3, and one or more humps on the gradation curves.
Procedure of Particle Size Analysis:
A sample of dry soil is poured onto the top sieve, the nest is covered, and it is then shaken by hand or mechanical sieve shaker until each particle has dropped to a sieve with openings too small to pass, and the particle is retained. The cumulative weight of all material larger than each sieve size is determined and divided by the total sample weight to obtain the percent retained for that sieve size and this value is subtracted from 100% to obtain the percent passing that sieve size. Results are displayed by plotting the percent passing (on a linear scale) against the sieve opening size (on a log scale) and connecting the plotted points with a smooth curve referred to as a grain-size distribution curve.
Here's an overview of the sieve analysis process:
-
Sample Preparation: A representative sample of the material is collected and brought to the laboratory. The sample is typically dried in an oven to remove any moisture content and prevent particle agglomeration.
-
Sieve Set-up: The sieves are arranged in a stack, starting with the sieve with the largest openings at the top and ending with the sieve with the smallest openings at the bottom. The sieves are securely clamped or fastened together to prevent any movement during the testing process.
-
Sieving Procedure: The dried sample is placed on the top sieve (largest openings) and a lid is placed on top. The entire stack of sieves is then mechanically or manually shaken for a fixed duration to ensure efficient separation of particles. The shaking action causes the smaller particles to pass through the openings of the sieves, while the larger particles are retained on the respective sieves.
-
Weighing and Recording: After the sieving process, the retained material on each sieve is carefully collected, weighed, and recorded. The weight of the material retained on each sieve is used to calculate the percentage of material passing through and retained on each sieve.
-
Particle Size Distribution: The data obtained from weighing the retained material on each sieve is plotted on a particle size distribution curve, also known as a grading curve. The curve represents the cumulative percentage of material passing through each sieve versus the particle size.
Particle Size Passing the Sieves:
 In Sieve analysis the notation Dxx refers to the size D, in mm, for which xx percent of the sample by weight passes a sieve mesh with an opening equal to D. The D10 size, sometimes called the effective grain size, is the grain diameter for which 10% of the sample (by weight) is finer.
It is determined from the grain size distribution curve at the point where the curve crosses a horizontal line through the 10% passing value on the y-axis. Other D sizes are found in a similar manner. The D50 size called the median grain size, is the grain diameter for which half the sample (by weight) is smaller and half is larger. Two parameters are used to describe the general shape of the grain-size distribution curve.
The shape, size, and distribution of particles in a soil influence:
- packing, the flow of water, and the strength of the soil
- provide engineers with basic data to assist in selecting and using soils as construction materials.
D10:
Effective particle size (D10) is the average particle diameter of the soil at the 10 percentile; that is, 10% of the particles are smaller than this size (diameter).
D50:
The average particle diameter (D50) is the average particle diameter of the soil.
Cu:
The uniformity coefficient (Cu) is a numerical measure to help interpret the distribution of particle sizes.
Cc:
The coefficient of curvature (Cc) is another numerical measure to help interpret the distribution of particle sizes.
Sieve Standards
|
Sieve No.
|
Millimeters |
|
4
|
4.75 |
|
10
|
2.00 |
|
20
|
0.841
|
|
40
|
0.420
|
|
70
|
0.210
|
|
100
|
0.150
|
|
200
|
0.075 |
|
Inches sieves |
Millimeters |
|
1.5 |
38.1 |
|
1.0 |
25.4 |
|
0.75 |
19 |
|
0.5 |
12.5 |
The results of sieve analysis provide valuable information about the gradation and particle size distribution of the material. This data helps engineers in several applications, such as designing and specifying aggregate for concrete, determining the suitability of soil for different construction purposes, assessing soil compaction characteristics, and evaluating the permeability and drainage properties of granular materials.
Sieve analysis is a fundamental test in geotechnical engineering and plays a crucial role in understanding and characterizing the behavior of soils and aggregates.