How to Design Barrage

How to Design Barrage
The Barrage and the Head Regulators of feeder channels and appurtenant structures will be designed on the basis of standard design criteria established for other barrages and allied structures, already constructed on the Indus River and its tributaries. The design criteria, including formulae, coefficients and constants will be used in all hydraulic designs as applicable.
There are two aspects of the design of a barrage i.e:
- Surface flow / Overflow consideration
- Safety against subsoil flow i.e. (by Bligh’s creep theory, Lane’s weighted creep theory and Khosla’s theory)
1. Surface Flow / Overflow Consideration:
Following items have to be estimated / designed in case of overflow considerations:
- Estimation of design flood.
- Length of barrage i.e. (Width between abutments)
- Retrogression
- Barrage profile i.e. upstream floor level, D/S floor level, crest level
1. Estimation of design flood:
The design flood (maximum flood) is estimated for which the barrage is to be designed depending upon the life of structure. The design flood estimation may be for 50 years, 100 years etc.
2. Length of Barrage (Width b/w Abutments):
Lacey’s formula can be used for fixing the length of barrage i.e. Pw = 4.75 Q
Where, Pw = Wetted perimeter Q = Maximum flood discharge
From t the length of barrage can be evaluated as, Length of barrage = L.L.C x Pw
Where, L.L.C = Lacey’s looseness coefficient Take L.L.C = 1.8, if not mentioned
3. Retrogression:
It is a temporary phenomenon which occurs after the construction of barrage in the river flowing through alluvial soil. As a result of back water effect and increase in the depth, the velocity of water decreases resulting in deposition of sedimentation load. The water flowing through the barrage have less silt, so water picks up silt from downstream bed. This results in lowering d/s river bed to a few miles. This is known as retrogression.
It may occur for the first few years and bed levels often recover their previous level. Within a few years, water flowing over the weir has a normal silt load and this cycle reverses. Then due to greater depth, silt is deposited and d/s bed recovers to equilibrium. Retrogression value is minimum for flood discharge and maximum for low discharge. The values vary (2 - 8.5) ft.
4. Accretion:
It is the reverse of retrogression and normally occurs upstream, although it may occur d/s after the retrogression cycle is complete. There is no accurate method for calculating the values of retrogression and accretion but the values which have been calculated from different barrages can be used as a guideline.
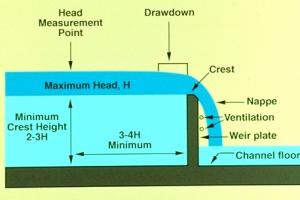
5. Barrage profile:
Crest level: The crest level is fixed by the total head required to pass the design flood over the crest. The pond level is taken as the H.F.L. Maximum scour depth can be calculated from Lacey’s scour formula,
R = 1.35 (q2f)1/3 (M.K.S) R = 0.9 (q2f) 1/3 (F.P.S)
Discharge per unit width,q = QL Velocity of Approach, V = qR Velocity head = v22g And discharge can be found using discharge formula, Q = CLH 3/2
Where C = Coefficient of discharge Taken as 2.03 (M.K.S), Q = Flood Discharge, L = Length of barrage crest , H=Total Energy Head = v22g + h
Estimation of Design Flood
Basis of Estimation
The design flood for any given return period is usually estimated by the frequency analysis method. Appropriate type of frequency distribution will be selected from among the following:
- Pearson & Log Pearson Type III distributions
- Gumbel's Extreme Value distributions
- Normal & Log Normal distributions
It is pertinent to point out that Log Pearson Type III distribution has been adopted by United States Federal Agencies whereas Gumbel distribution has generally been found to be suitable for most of the streams in Pakistan including river Indus and its tributaries.
Design Return Period
A return period of 100 years is generally adopted in the design of important and costly barrage structures where possible consequences of failure are very serious. Accordingly, the estimation of design flood will be carried out for various return periods of 100 years, 200 and 500 years subject to Client's concurrence. However, the actual recorded peak flood discharge will be reviewed for design if it exceeds the discharge calculated for the concerned return period.
Hydraulic Units
The dimensions and units of properties used in solving hydraulic problems are expressed in three fundamental quantities of Mass (M), Length (L), and time (T). All analyses and designs will be carried out in the Foot-Pound-Second system of units and conversion to S.I Units will be made only of important results as necessary.
Width of Barrage
Three considerations govern the width of a barrage. They are the design flood, the Lacey design width and the looseness factor. It is generally thought that by limiting the waterway, the shoal formation upstream can be eliminated. However, it increases the intensity of discharge and consequently the section of the structure becomes heavier with excessive gate heights and cost increases, though the length of the structure is reduced.
The design flood is discussed in section 2.2 and the other two considerations are discussed in the following sections.
Lacey's Design Width
The Lacey's Design or Stable width for single channel is expressed as:
W = 2.67 v Q
Where Q is the Design Discharge in cusecs (ft3/sec).
The Barrage is designed for a width exceeding W, partly to accommodate the floodplain discharge and partly to take advantage of the dispersion of the channel flow induced by the obstruction caused by the barrage itself.
The Looseness Factor
The ratio of actual width to the regime width is the "looseness factor", the third parameter affecting the barrage width. The values used have varied from 1.9 to 0.9, the larger factor being applied in the earlier design. Generally it varies from 1.1 to 1.5. From the performance of these structures, a feeling arises in certain quarters that with high Looseness Factor, there is a tendency for shoal formation upstream of the structures, which causes damages and maintenance problems. The Consultants will use the most appropriate looseness factor to provide reasonable flexibility keeping the ill effects to the minimum.
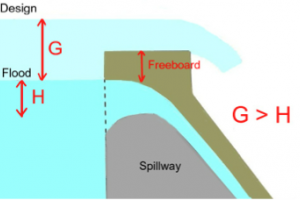
Afflux
The rise in maximum flood level of the river upstream of the barrage as a result of its construction is defined as Afflux. Afflux, though confined in the beginning to a short length of the river above the barrage, extends gradually very far up till the final slope of the river upstream of the barrage is established.
In the design of barrages/weirs founded on alluvial sands, the afflux is limited to between 3 and 4 feet - more commonly 3 feet. The amount of afflux will determine the top levels of guide banks and their lengths, and the top levels and sections of flood protection bunds. It will govern the dynamic action, as greater the afflux or fall of levels from upstream to downstream the greater will be the action. It will also control the depth and location of the standing wave. By providing a high afflux the width of the barrage can be narrowed but the cost of training works will go up and the risk of failure by out flanking will increase. Selection and adoption of a realistic medium value is imperative.
Tail Water Rating Curve
Tail water rating curve for the barrages will be established through analysis of gauge discharge data. The proposed tail water levels for new designs will be established by subtracting the designed retrogression values from the existing average tail water levels.
Crest Levels
Fixation of crest level is clearly related with the permissible looseness factor and the discharge intensity in terms of discharge per foot of the overflow section of the barrage. After considering all the relevant factors and the experience on similar structures the crest levels will be fixed in order to pass the design flood at the normal pond level with all the gates fully open.
Discharges through a Barrage (Free Flow Conditions)
The discharge through a Barrage under free flow conditions shall be obtained from the following formula:
Q = C. L . H3/2 .......(1)
Where,
Q = discharge in cusecs
C = Coefficient of Discharge
L = Clear waterway of the Barrage (ft)
H = Total Head causing the flow in ft
The value of C is generally taken as 3.09, but may approach a maximum value of 3.8 for modular weir operation (Gibson). However to design a new barrage it will be determined by physical model studies.
Discharge through a Barrage (Submerged Flow Conditions)
The flow over the weir is modular when it is independent of variations in downstream water level. For this to occur, the downstream energy head over crest (E2) must not rise beyond eighty (80) percent of the upstream energy head over crest (E1). The ratio (E2/E1) is the "modular ratio" and the "modular limit" is the value (E2/E1 = 0.80) of the modular ratio at which flow ceases to be free.
Fane's Curve
For submerged (non - modular) flow the discharge coefficient in equation (1) above should be multiplied by a reduction factor. The reduction factor depends on the modular ratio (E2/E1) and the values of reduction factor (Cr) given in the table below are from Fane's curve (Ref: 2.3) which is applicable to weirs having upstream ramp and sloping downstream with slope 2H:1V or flatter:
|
"E2/E1 " |
Value of "Cr" |
|
0.80 |
0.99 |
|
0.85 |
0.99 |
|
0.90 |
0.98 |
|
0.92 |
0.96 |
|
0.94 |
0.90 |
|
0.95 |
0.84 |
|
0.96 |
0.77 |
|
0.97 |
0.71 |
|
0.98 |
0.61 |
The submerged discharge is given by the equation:
Q = 3.09. Cr.b .E11.5
Gibson Curve
Q = C'bE1.5
Where:
Q = submerged discharge over crest (cusecs)
C' = submerged discharge coefficient
B = width of weir (ft)
E1 = upstream energy head above crest
= h1 + v12/2g (ft)
For submerged discharges the free flow discharge coefficient (C=3.80) is multiplied by a reduction factor (C'/C). The coefficient factor depends on the modular ratio (h/E), where his downstream depth of flow above crest. The values of reduction factor "C'/C" given in the table below are from Gibson curve applicable to the broad crested weirs:
|
h/E |
C'/C |
C' |
|
0.70 |
0.86 |
3.27 |
|
0.80 |
0.78 |
2.96 |
|
0.90 |
0.62 |
2.36 |
|
0.95 |
0.44 |
1.67 |